Stop-Loss Insurance Attachment Point Selection for Self-Funded Plans
Catastrophic claims are surging, forcing plan sponsors to rethink their risk transfer strategy.

Selecting a stop-loss attachment point is a math problem dressed up as a coverage decision, and too many self-funded plan sponsors treat it as a checkbox instead. The number a sponsor picks determines how much claims risk stays on the plan's own balance sheet versus how much gets transferred to a carrier, and getting it wrong in either direction costs real money: too low, and premium eats the savings self-funding was supposed to generate; too high, and a single bad claims year can strain cash reserves past the breaking point. Self-funded arrangements already cover more than 60% of workers in the U.S., and level-funded plans alone cover 37% of workers at firms with 10 to 199 employees, so this is no longer a decision reserved for large, sophisticated employers with actuaries on staff. It's a mainstream calibration exercise, and it deserves to be treated like one.
Under a self-funded arrangement, the employer pays claims first, out of its own funds, and stop-loss reimburses afterward according to the terms of the policy. That sequencing matters enormously for cash planning: an employer needs reserves or a credit line sufficient to bridge the gap between paying a claim and receiving reimbursement, because the stop-loss carrier is not paying providers directly. Members experience none of this. They use the plan normally, with claims processed and paid as usual, while stop-loss operates entirely behind the scenes as a financial backstop for the employer. None of this replaces sound plan management, either. Stop-loss caps exposure once claims cross a defined line; it does nothing to prevent claims from reaching that line.
Specific and aggregate attachment points as two distinct layers of protection
Specific stop-loss, sometimes called individual stop-loss, protects against severity. It applies per covered person: if one member's eligible claims in a plan year exceed the specific deductible, the carrier reimburses the excess up to the policy's maximum benefit limit. Say the specific deductible is $100,000 and a member incurs $180,000 in eligible claims over the year. The employer pays the first $100,000 as part of normal plan operation, and the remaining $80,000 gets submitted to the carrier for reimbursement. That $80,000 never would have existed as a "problem" without a single catastrophic claimant, and that's exactly the scenario specific stop-loss exists to contain. Complex diagnoses, specialty medications, premature births, transplants, cancer treatment, and ongoing chronic conditions are the usual sources of claims large enough to breach a specific deductible.
Aggregate stop-loss solves a different problem entirely: frequency rather than severity. It doesn't care whether any single claimant crossed a threshold. It looks at the plan's total claims for the year, and once that cumulative total exceeds the aggregate attachment point, the carrier covers the excess. A plan can have zero claims large enough to trigger specific stop-loss and still get hammered by aggregate exposure, if enough members have moderately expensive years all at once. The two layers work together, not separately, and sponsors who evaluate them in isolation are missing half the picture.
The claims environment that attachment points are being set into right now
Stop-loss premiums are not standing still. They rose 8.8% to 10% in 2025, based on data covering 1,268 plan sponsors, over 1.2 million employees, and more than $1.2 billion in annual stop-loss premium. Longer-term growth figures from Aegis, running 9.9% to 12.1%, may capture 2026 impacts more accurately than single-year snapshots. Segal separately tracked a 9.4% average increase in 2024, a figure that climbed to 11.5% for employers who kept their coverage terms unchanged rather than adjusting deductibles or benefit limits to manage cost.
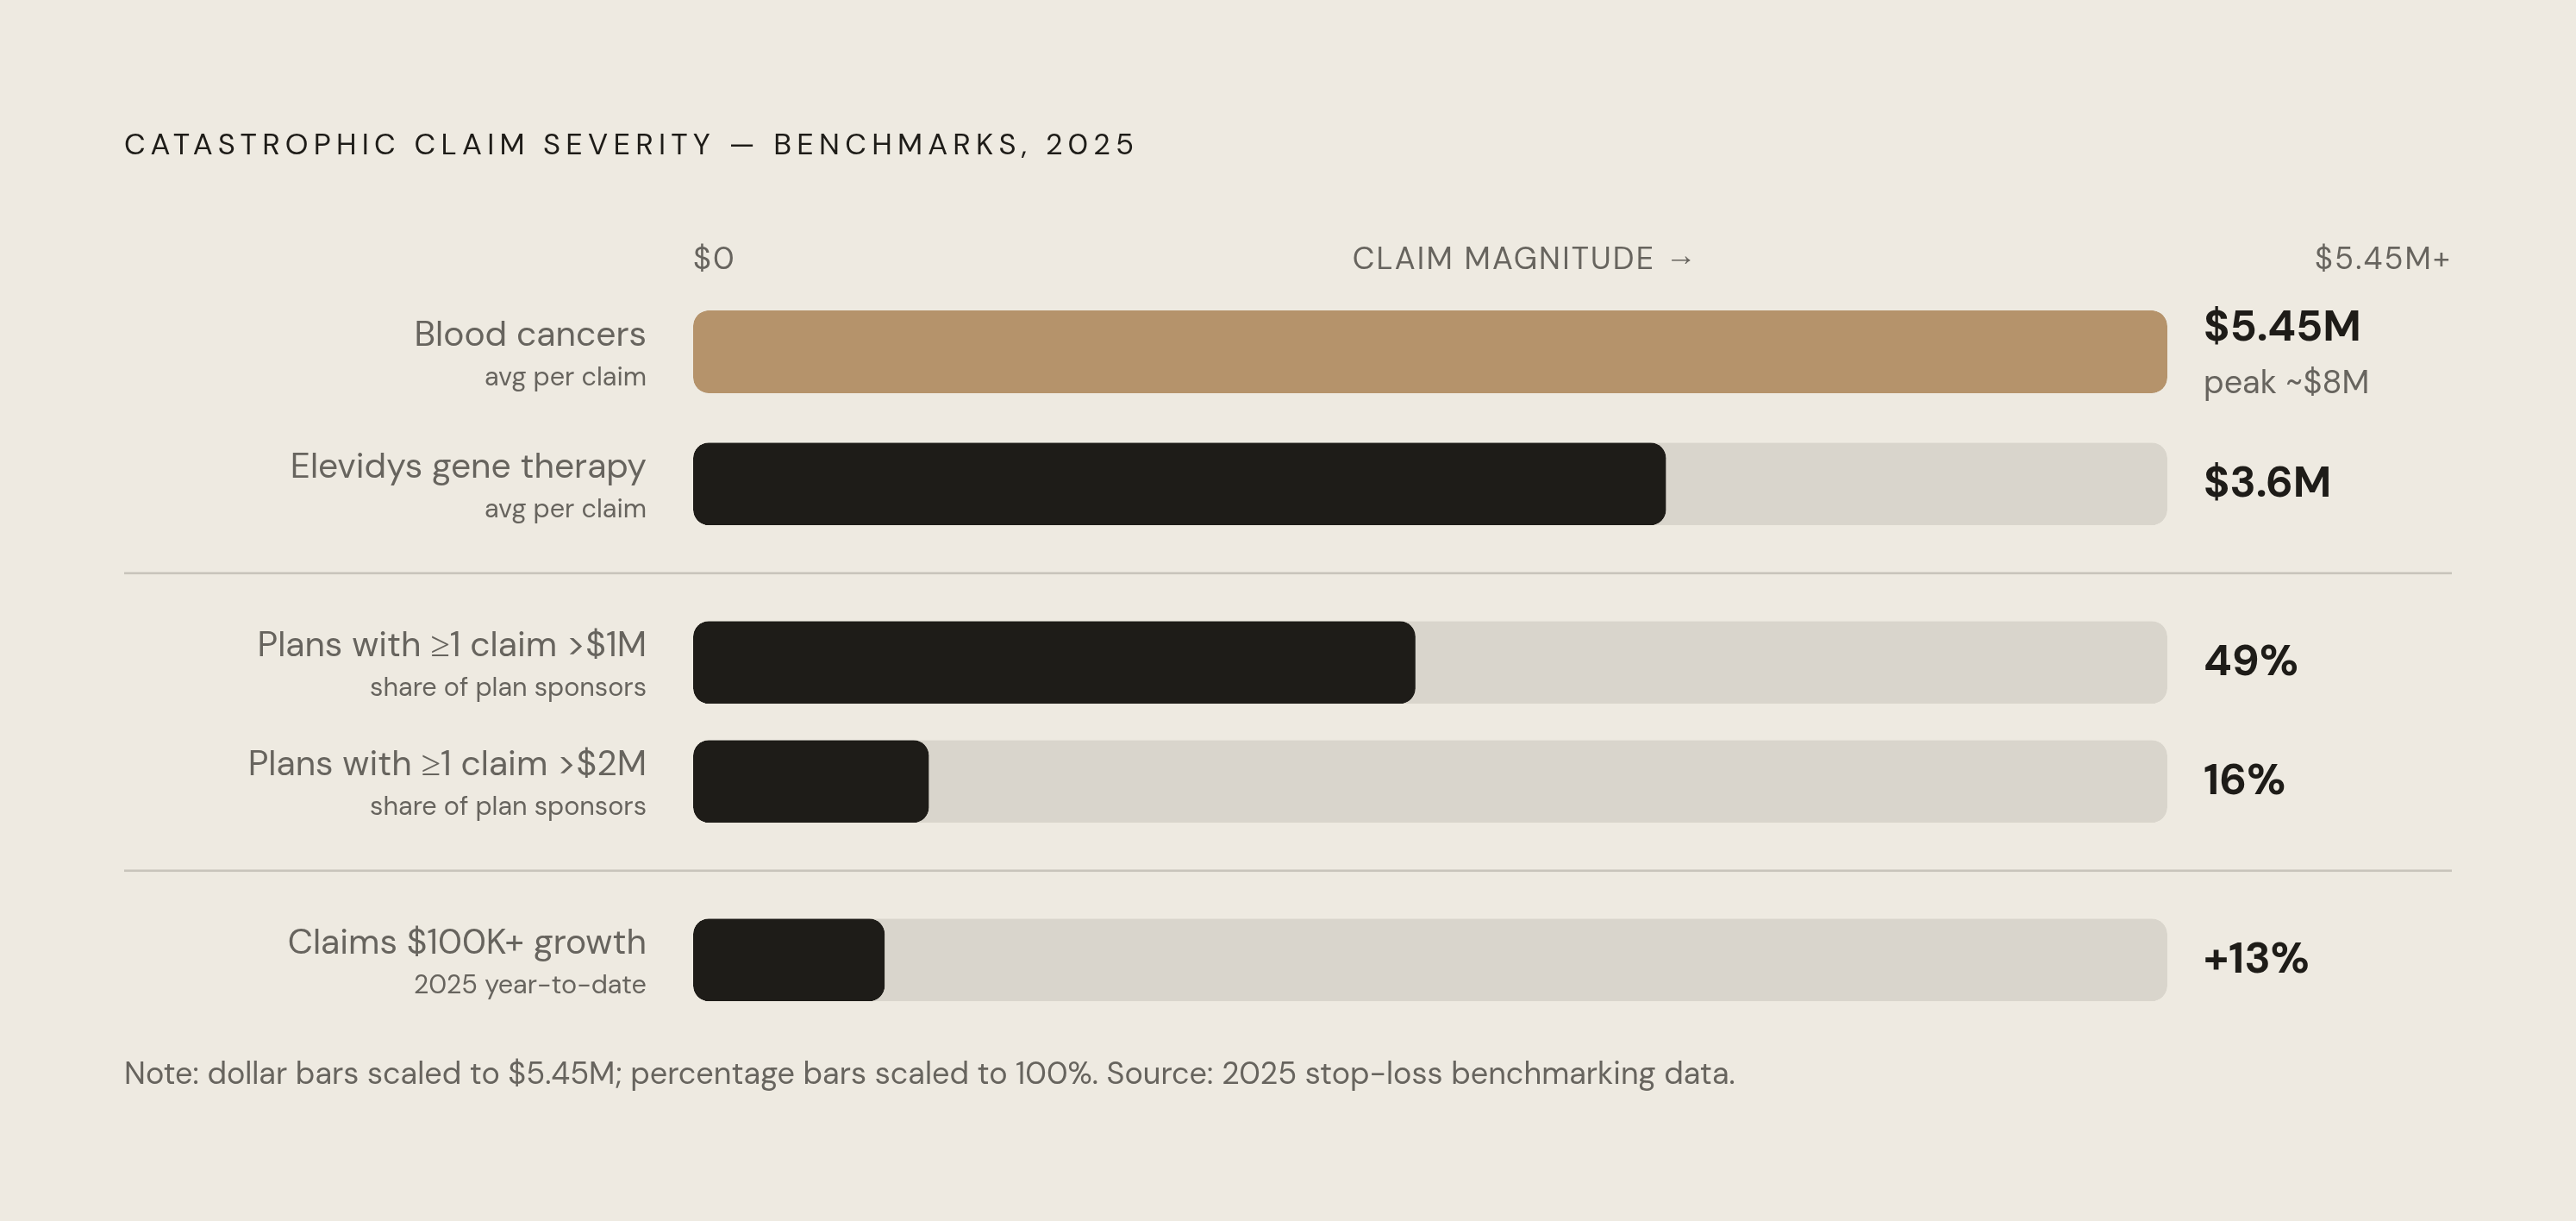
The driver behind those numbers is not mysterious: catastrophic claims are getting bigger, and they're getting bigger fast. The cost of catastrophic claims totaling $100,000 or more rose nearly 13% in 2025 alone. Million-dollar claims, once rare enough to be a talking point at renewal meetings, are now close to routine: 49% of plan sponsors report at least one claim exceeding $1 million, 16% report a claim exceeding $2 million, and roughly one in six plan sponsors has seen a $2 million claim firsthand. An attachment point set five years ago against a claims environment that no longer exists is not a conservative choice. It's an outdated one.
Specialty drugs and gene therapies redefining the upper end of claims severity
The ceiling on claims severity keeps rising because the treatments driving it keep advancing. Sun Life's 2026 report, built from more than 70,000 high-dollar claims across over 3,300 self-funded employers, found blood cancers producing the highest multimillion-dollar claims of any category, averaging $5.45 million in 2025. The single largest leukemia claim in that dataset approached $8 million. That is not a typo, and it is not an outlier so extreme it can be dismissed as noise; it's a data point from a large enough sample to reflect a real, recurring exposure.
Drug therapy is doing its own share of the work here. The costliest treatment in Sun Life's dataset was Elevidys, a gene therapy for Duchenne muscular dystrophy, averaging $3.6 million per claim. QBE's 2026 market report adds another layer: neoplasm claim severity at the $200,000 deductible level rose 12% over the prior-year average, while frequency at that same level climbed nearly 30%. Birth-related claim frequency more than doubled between 2024 and 2025, a shift significant enough to change how sponsors of plans with younger workforces should think about specific attachment points.
Specialty drugs are a major driver of this trend, producing a concentration of spend that shows up directly in the data. Payer Matrix data shows 45% of drug spend now comes from just 5% of members, and specialty medications already account for half of all drug spending, with projections suggesting that share could exceed 60% in 2026. Attachment points set without accounting for the concentration of cost in a small slice of the population are, by construction, set against last decade's risk profile rather than this one's.
Employer size and the realistic range for a specific attachment point
Group size changes the math, and it changes it predictably. Larger populations distribute risk across more lives. The odds of several high-cost claimants landing in the same plan year, in the same period, get smoother and more statistically manageable as the group grows. A plan covering thousands of lives can absorb a higher specific deductible than one covering a hundred, because a single catastrophic claim represents a smaller share of total plan cost.
Small groups, roughly 50 to 150 covered lives, typically run specific attachment points between $50,000 and $100,000. At that size, a single high-cost claimant can swing total claims by 10% to 15% in a single year, so the deductible needs to sit low enough to contain that swing before it becomes a solvency event. Mid-market plans, covering 200 to 1,000 lives, most commonly run $100,000 to $150,000, with the fuller spread running from $75,000 to $200,000 depending on the sponsor's other risk factors. Employers in the 50-to-500-employee band generally see deductibles between $50,000 and $125,000, with smaller groups within that band averaging closer to $70,000 to $78,000. These are corridors grounded in how claims volatility actually behaves at different population sizes.
The factors that move an attachment point up or down within those ranges
Size sets the corridor. A handful of other factors decide where inside that corridor a given plan actually lands.
Risk tolerance is the most direct tradeoff, and it needs to be named explicitly rather than left implicit in a broker's recommendation. A higher attachment point lowers premium but increases the amount of out-of-pocket exposure the employer carries before the carrier steps in. A lower attachment point raises premium but tightens the cap on liability. Neither choice is objectively correct; the right answer depends on what the sponsor can actually absorb financially.
That leads directly to cash flow and reserves, which for many smaller self-funded plans turns out to be the binding constraint, more than risk appetite in the abstract. The specific deductible is, functionally, the maximum amount an employer commits to paying for one individual before stop-loss activates. That amount has to be fundable from operating cash flow or reserves without creating a liquidity crunch, and a sponsor that can't stomach a $100,000 hit in a single quarter has no business selecting a $100,000 deductible just because it fits the mid-market benchmark.
Claims history matters too, and three to five years of prior data tells a sponsor what its realistic high end actually looks like. A plan that has never seen an individual claim above $80,000 is in a fundamentally different risk position than one that has already had two claims above $300,000, even if both plans are the same size. Demographics round out the picture: younger, lower-risk workforces carry more statistical cushion, while plans with an older population or a higher prevalence of chronic conditions warrant a tighter, lower specific attachment point regardless of what the size-based benchmark suggests.
The aggregate attachment point's connection to the specific threshold and plan-level cash planning
The specific deductible and the aggregate attachment point are not two separate decisions made in sequence. They're one decision made in two parts, because the specific threshold directly shapes how much claims volume ends up flowing into the aggregate layer.
Set the specific deductible low, and individual severity gets contained early, but more claims volume, including a lot of moderate-sized claims that never would have breached a higher deductible, now counts toward the aggregate total. If a plan has many employees with claims sitting just under the specific deductible, aggregate exposure can build quickly and unexpectedly. The aggregate attachment point, typically set at 125% of expected annual claims, exists precisely to absorb that kind of cumulative pressure: the normal band of year-to-year claims variability that no single claim explains but that adds up regardless.
Cash flow timing separates the two layers in a way sponsors sometimes miss until it matters. Specific reimbursements can arrive mid-year, as soon as an individual claimant crosses the deductible. Aggregate reimbursement typically doesn't arrive until after the contract year closes. That means a sponsor has to fund claims in real time, all year, before any aggregate check materializes, regardless of how confident the plan is that it will eventually stay under the aggregate corridor.
Practical steps for selecting and stress-testing an attachment point before binding coverage
Start with a claims baseline. Pull three to five years of individual and aggregate claims data, identify the single highest-cost claimant in any year, and check how that history would have played out against different specific deductible levels. This is the foundation everything else builds on, and skipping it means every later step is guesswork dressed up as analysis.
Map the size-based benchmarks against the actual group, but treat them as a starting corridor to interrogate, not a default to accept. The ranges by covered lives are a reasonable first pass; they are not a substitute for the plan's own claims history and risk tolerance.
Then run the premium tradeoff in hard numbers. Market benchmarks, like the Aegis survey figures broken out by deductible level, make it possible to see how attachment point movement translates into measurable premium differences. That turns an abstract risk-appetite conversation into a financially legible one: the sponsor can see, in dollars, what it's buying and what it's giving up at each threshold.
Finally, stress-test the worst plausible year. Model a scenario where the specific deductible gets hit by multiple individuals and the aggregate corridor gets breached in the same twelve months, and check if the plan can actually fund claims in real time while waiting for reimbursement. If the answer is no, the attachment point is set too high for the plan's actual cash position, full stop. At that point the sponsor has two real options: lower the attachment point, or establish a credit facility sized to bridge the gap. Either is defensible. Ignoring the question is not.